
Another college soccer season is now history. Have you ever wondered why some teams have seasons in which they fall short of expectations and why some teams bounce back after a down season and others don't. If so, you should find the research performed by Louis, Nicholas and Mark Joslyn very insightful and interesting.
Falling Short of Expectations – The Indiana 2013 Case – By Louis Joslny, Nicholas Joslyn and Mark Joslyn
In 2012, the Indiana Hoosiers men’s soccer team notched their eighth national championship. Since the program began in 1973, the Hoosiers accumulated more national championships, College Cup appearances, and a higher winning percentage in both regular and post season than any other Division 1 school. However, only one year removed from the 2012 championship season, Indiana recorded its worst win-loss record in history at 8 – 12 -2 (.409).
The program had never experienced a .500 record, let alone a losing season. Just a year later, though, in 2014, Indiana recovered and resumed its usual excellence. What factors produced this uncharacteristic 2013 season? We focus on Indiana’s 2013 season as it speaks to the larger issue of underperformance. That is, why do some teams fail to reach winning expectations? Our approach to this question begins with an important team metric that predicts season win percentages.
Total Shots Ratio
Total Shots Ratio (TSR) is the key measure that distinguishes losing from winning squads (Grayson 2012a; Goodman 2013; Taylor 2014). TSR quantifies how frequently a team shoots compared to their opponents. For example, if Akron attempted a total of 8 shots, while conceding 12, Akron’s TSR is 8/ (8+12) = 0.40. A value of 0.50 signifies a team conceded as many shots as it took, and a value over or under 0.50 indicates one team outshooting the other.
Analyses of season TSRs in the pro game show it to be an excellent predictor of season point totals, and one of the few metrics that teams can repeat from one year to the next (Grayson 2012b). In addition, TSR is correlated with possession. Teams that produce more shots than the opposition are in general the teams that possess the ball. Prior analyses show that TSR produces superb forecasts for season win percentage in the college game as well (Joslyn, Joslyn, and Joslyn 2017a).
Indiana’s TSR and Win Percentage
We accessed Indiana’s soccer statistical archives from the Big Ten soccer web site (Big Ten 2017). Season total shots, shots conceded, and win percentage were collected and TSR values calculated.
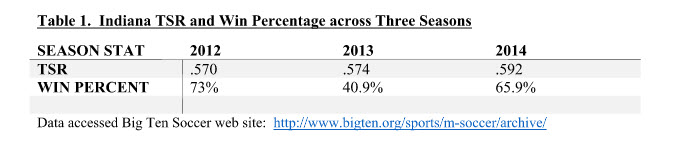
Table 1 compares TSRs and win percentages across 2012-2014 seasons. Three findings are noteworthy. First, Indiana exhibited high TSRs across the three years. These values were in the top quarter of all Division 1 teams. This is what we expect given Indiana’s tradition of excellence. Second, TSRs are remarkably stable. They scarcely change from the 2012 championship year to 2013, then increase marginally in 2014. Third, in contrast to TSR, win percentage clearly varies. For this three-year window, Indiana sustained an impressive level of shot dominance but also a troubling variance in win percentage. It appears Indiana underperformed in 2013.
Measuring Underperformance
By using a statistical technique called linear regression we can quantify the actual level of team underperformance for the 2013 season. We collected 2013 season box score data from the NCAA web site (NCAA 2013) for all Division 1 men’s teams. We then calculated team TSRs and mapped them across each team’s win percentage.
Figure 1 depicts the association. Circles represent individual teams. Higher value TSR teams enjoy substantially better winning percentages than lower value TSR teams. A Pearson correlation quantifies the relationship. The closer the correlation is to +1 the stronger the association between TSR and win percentage. The Pearson correlation here is a strong and positive 0.69.
The green line imposed on the scatter is the best fit to the data and yields an expected win percentage given a specific TSR. For example, eyeing the graph and following the green diagonal, you can see that a TSR of 0.30 generates an expected win percentage of 20%. A 0.70 TSR yields an extraordinary win percentage of 80%.
Figure 1
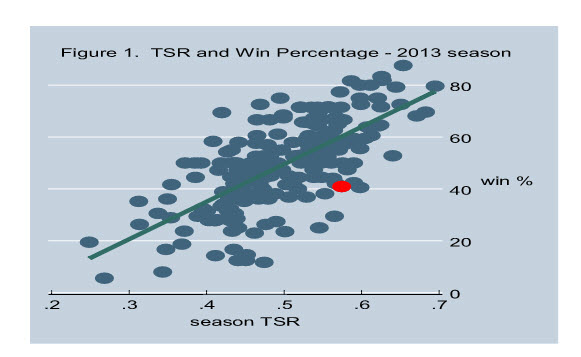
The red circle is Indiana. As noted, the Hoosiers’ TSR ranked in the top quarter of teams but its win percentage dropped substantially below the expected win line – the green diagonal.
We evaluated the degree of Indiana’s underperformance bystarting at the red circle and moving north to the green line. The vertical distance represents the difference in win percentage between the actual and predicted performance. The predicted win percentage, 60%, subtracted from the actual, 40.9%, yields the degree of underperformance – approximately 20%. Undoubtedly, losing about four games more than expected generated much frustration in Bloomington.
However, as Figure 1 reveals, Indiana was not alone. Several teams are in close proximity to Indiana. These teams also produced notable TSRs but did not achieve winning percentages better than 50%, and clearly many more teams did not reach the expected win line. We will return to these other underperforming teams in the last section.
Why Indiana Underperformed
We now focus on Indiana’s ability to convert shots into goals and defending their own goal. Finishing is notoriously difficult skill to repeat and luck plays a significant role in goal scoring (Anderson and Sally 2014). After losing efforts, coaches often lament missed opportunities or a lack of precision and poise in the attacking third. Similarly, coaches may tip their hats to the opposition, noting that the other team took its chances well.
Indiana across Time
How efficient was Indiana in converting its chances? In addition, how well did the opposition take its chances? What impact does attacking and opposition efficiency have on win percentage? We collected season totals from Indiana’s 2007 season thru 2015. Team efficiency reflects the number of goals divided by total shots. In 2013, the Division 1 average attacking and opposition efficiency was one goal for every 10 shots (0.10).
A review was conducted of Indiana’s attacking and its opposition efficiency on win percentages across 9 seasons. It demonstrated that Indiana's attacking efficiency does not significantly influence win percentage. That is, poor and excellent attacking efficiency led to similar win percentages. For example, in 2015, Indiana scored one goal for every 12 shots yet nevertheless won nearly 70% of their matches. In 2011, Indiana equaled that win percentage of 70% but was decidedly more efficient in front of goal, converting 1 goal for every 7.5 shots. In addition, during Indiana’s worst season, 2013, attacking efficiency was equivalent or better than five other seasons that produced much higher win percentages.
However a review of the same time period demonstrated that win percentage and opposition efficiency were closely intertwined. When the opposition finished its chances, Indiana’s win percentage dropped quickly. In better defending years, Indiana’s win percentages increased. The year 2013 stood apart from the rest. In 2013, Indiana’s opposition converted one in every seven shots to goals (0.14)! Opposition efficiency therefore appears to be the key measure for understanding Indiana’s underperformance.
Efficiency Differential: We now compare Indiana’s efficiency relative to its competition. We call it the efficiency differential. The idea is that greater attacking efficiency, compared to the opposition, should increase the likelihood of winning. A differential greater than zero favors Indiana; a finishing rate better than its competitors. Values less than zero indicate the opposition finished its chances more efficiently.
Figure 3
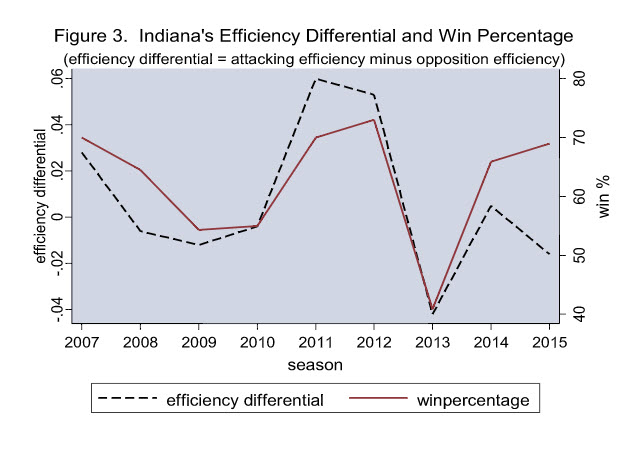
Figure 3 traces the efficiency differential across seasons and shows a strong relationship to win percentage. Higher differentials, better than zero, produce excellent winning records, most notably the elevated points in 2011 and the 2012 championship run. Predictably, the differential low point is 2013. It is worth noting that in 2014, Indiana rebounded to a much improved win percentage and a differential slightly above zero. The differential then dipped slightly below zero in 2015 but never reached the depths of 2013.
Back to Normal
 Timely goals and sustained defensive excellence is difficult to repeat year after year (Joslyn, Joslyn, and Joslyn 2017b). This is true for all programs. In some matches, chance seems to be the principal factor dictating the outcome. Given the short college season of approximately twenty games, a few unfortunate breaks can jeopardize an entire year. In addition, players graduate and rosters can change significantly from one year to the next.
However, the strength of a team’s TSR level should, over time, align with expected wins. This appears to be the case for Indiana. Indiana’s 25% improvement in win percentage in 2014 matched expectations. The turnaround included increased attacking efficiency to the Division 1 average (.104) and a substantial reduction in opposition efficiency to below the average (.095); anefficiency differential slightly above zero.
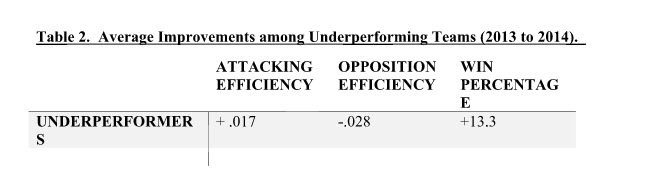
We can determine how common bounce back years are for teams that underperformed like Indiana. Eleven teams in 2013, including Indiana, produced TSR values in the top quarter of Division 1 (0.55 or better) yet failed to reach a winning percentage better than .500.
For this group of underperformers, Table 2 shows average improvements in win percentage, attacking and opposition efficiency from 2013 to 2014 season. Improvements exist across all three measures. However, improvement in opposition efficiency is most striking. The negative sign indicates underperforming teams defended their goals substantially better in 2014. While they also finished in front of their own net with greater efficiency, as in the Indiana example, the substantial improvement in win percentage occurred primarily because the opposition was not nearly as clinical.
Conclusions
We draw several conclusions from this analyses of underperformance.
First, using the Indiana case, we defined team underperformance and then quantified it. Underperformance is the difference between a team’s actual season win percentage and what would be expected given that team’s Total Shot Ratio. We showed Indiana’s winning percentage in 2013 was approximately 20% less than expected. This method can be used to determine underperformance for any team, at any level of soccer, provided typical box score measures are available.
Second, we then asked what factors generated underperformance. For Indiana, as well as for 10 other teams that underperformed similarly in 2013, the primary cause was an unusually high level of opposition efficiency. Whether it was poor defending, a large dose of misfortune, or a little of both we cannot say.
Third, in the very next season we showed Indiana rebounded quickly – as did most of the underperformers we examined. They did this primarily by improving opposition efficiency. The opposition was not nearly as clinical, and as a result Indiana once more achieved expected levels of wins and losses.
In summary, our analyses do suggest that unexpectedly poor years can be attributed to defending. When thinking about losses, however, coaches, fans, and players often ruminate on those chances that were “oh so close”. And of course it is true, teams that score more goals than opponents will win. But it is equally true that conceding fewer goals will produce that same outcome. It is difficult to find the right balance. Indiana’s example shows that even great programs, largely winning the shot battles, can still experience a losing season. In that case, the attack is only as valuable as your defense will allow.
Notes
[1] The major limitation of TSR is that it does not take into account the quality of a shot. Nor does TSR reflect the nature of play that preceded the shot. For example, a one-two exchange in the box that produces a dangerous chance is weighted the same as a 40-yard strike. Nevertheless, as we showed before, given the limited data of a typical college soccer box score TSR remains the best predictor of team success.
[1] We also found this same pattern in 2013 match data. In every game where the opposition was more efficient than Indiana (10 games), no matter the degree, Indiana lost the match. When Indiana was most efficient they won eight out of 10 games. Not bad, but not the same as when the opposition was most efficient The take-away here is in 2013 Indiana allowed the opposition to be more efficient than in all past seasons we examined.
References
Big Ten 2017. Archives accessed at: http://www.bigten.org/sports/m-soccer/archive/
Goodman, Mike. 2013. “What is Total Shots Ratio? And How Can It Improve Your Understanding of Soccer?” Grantland.com Accessed here: http://grantland.com/the-triangle/what-is-total-shots-ratio-and-how-can-it-improve-your-understanding-of-soccer/
Grayson, James. 2012a. “Another post about TSR” James Blog. Accessed at: https://jameswgrayson.wordpress.com/2012/07/15/another-post-about-tsr/
Grayson James. 2012a. “How Quickly Do Advanced Metrics Regress to their Final Values.” James Blog. Accessed at: https://jameswgrayson.wordpress.com/2012/11/27/how-quickly-do-the-advanced-stats-regress-to-their-final-values/
Joslyn, Louis., Nicholas Joslyn and Mark Joslyn. 2017a. “The Impact of Shots, Shots Against and Total Shots Ratio in College Soccer.” College Soccer News. Feb, 22.
Joslyn, Louis., Nicholas Joslyn and Mark Joslyn. 2017b. “What Delivers an Improved Season in Men’s College Soccer? The Relative Effects of Shots, Attacking and Defending Scoring Efficiency on Year-to-Year Change in Season Win Percentage.” The Sport Journal. Vol. 19. June 29th. http://thesportjournal.org/article/what-delivers-an-improved-season-in-mens-college-soccer-the-relative-effects-of-shots-attacking-and-defending-scoring-efficiency-on-year-to-year-change-in-season-win-percentage/
NCAA 2013. http://stats.ncaa.org/team/inst_team_list?academic_year=2014&conf_id=-1&division=1&sport_code=MSO
Taylor, Mark. 2014. Soccer betting: Total Shot Ratio & match odds in the EPL. accessed at: https://www.pinnacle.com/en/betting-articles/Soccer/tsr-in-epl/RNC2FZLKHLWJ4329
Louis R. Joslyn and Nicholas J. Joslyn played soccer at Simpson College in Baldwin City, Kansas where they were multi-year starters. Mark R. Joslyn is a Professor in the Political Science Department of the University of Kansas and was the Baldwin Kansas HIgh School School Boys Soccer Coach from 2010 through 2014. Mark Joslyn can be reached via e-mail at mjoz@ku.edu